Estimated reading time: 12 mins
This is my final criticism post for Case Against Education by Bryan Caplan. (Click here for my summary of the book.) My first post argued that the book really only presents a case against higher education. My second post explained how Caplan inflates his signalling estimates by conflating it with ability bias.
In this post, I respond to Caplan’s complaint that no one cared about his math or spreadsheets. I also conclude with some observations on Caplan’s overall tone and approach.
Doesn’t anyone care about math or evidence?
In a blog post, Caplan laments:
The most painful part of writing The Case Against Education was calculating the return to education. I spent fifteen months working on the spreadsheets. I came up with the baseline case, did scores of “variations on a theme,” noticed a small mistake or blind alley, then started over. …
When the book finally came out, I published final versions of all the spreadsheets underlying the book’s return to education calculations. A one-to-one correspondence between what’s in the book and what I shared with the world. Full transparency.
… Yet since the book’s publication, no one has bothered to challenge my math. Not publicly. Not privately. No one cared about my spreadsheets.
He concludes that quantitative social science is “barely relevant in the real world”, and that “even empirical researchers barely care what empirical social science really has to teach”.
I’m not surprised no one’s challenged Caplan’s math. The Case Against Education is written for a popular audience. It’s the kind of book you read before bed, or curled up in your favourite armchair. It’s not the kind of book you’d read at your desk, carefully checking the references and calculations. Caplan is well aware of this—his provocative and polemical tone does not signal a serious academic work.
The spreadsheets were clunky
Now, in case you haven’t noticed, I’m a bit of a weirdo in that I write unusually detailed summaries. I don’t check everything but I’ve read The Case Against Education more carefully than probably 99% of readers. And, in preparing my summary, I downloaded quite a few (but not all) of Caplan’s spreadsheets1I should also point out that Bryan Caplan’s site does not have an SSL certificate so my browser warned me that the download might be infected. I (perhaps recklessly) pressed on but that could have also deterred more cautious people. and spent fair bit of time trying to make sense of them.
But I couldn’t. The spreadsheets were far too clunky.
I admit I’m not a professional quantitative analyst or modeller. But I’m reasonably math literate. In my previous role as a policy analyst, I often worked closely with forecasters to try and estimate costs of different policies. Estimates are always based on many assumptions, such as when would the policy start? Who would be affected? How much non-compliance should we expect? The forecaster would come up with the basic model (in consultation with the policy analyst) and design their spreadsheets so that you could plug in different assumptions and see how that would affect the estimates. Not only could you see how changing the policy’s start date would affect its costs, you’d also be able to offer estimates with confidence intervals when a critical assumption was uncertain.
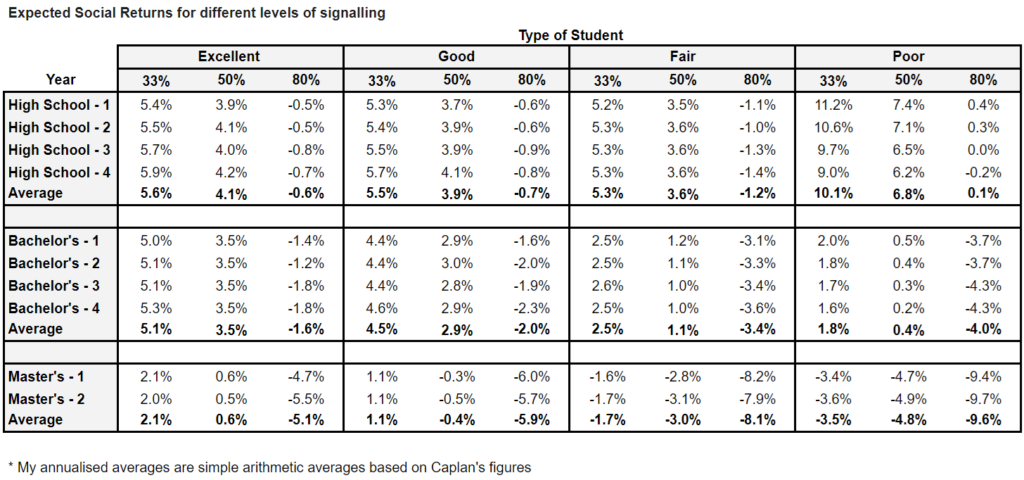
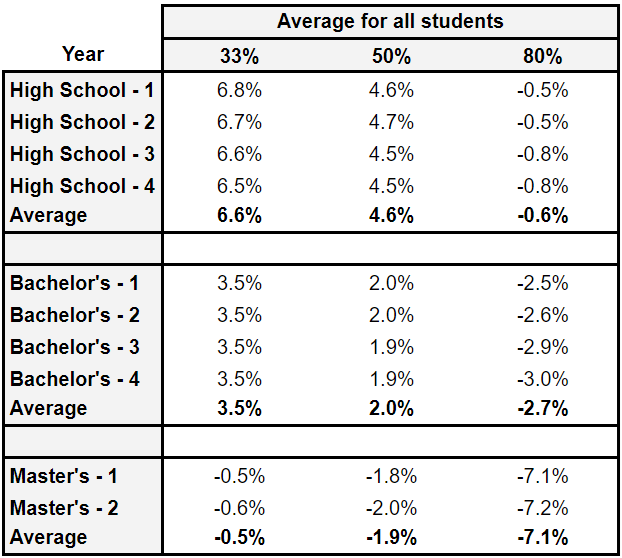
For Caplan’s social returns, the signalling assumption is certainly a critical one. The returns are highly sensitive to it and there’s considerable uncertainty on how much signalling there is. So it’s frankly mindboggling that his spreadsheets don’t let users change this assumption. Instead, as my screenshot below shows, each signalling assumption (33%, 50%, 66%, 80%) is in a different file, one for each type of student (Excellent, Good, Fair, Poor). This is why I felt the need to prepare summary tables for the results.

If you’re thinking that, it gets better once you open up the spreadsheets? Trust me. It doesn’t. Caplan made no effort to make his spreadsheets usable for others.
It reminded me of my earlier career in litigation. “Data dumps”, where one side buries the other under an avalanche of documents, are not uncommon during discovery. Sometimes this is deliberate—people may do this to rack up the other side’s costs and put pressure on them to settle, or to try and obscure damaging information. But there can also be more innocent explanations, like general incompetence and crappy document management practices.
I don’t know why Caplan’s spreadsheets were so difficult to use. It’s possible that, as an academic, he’s not used to working with others and doesn’t know how to build user-friendly models. I’ll give him some credit for making his spreadsheets available online and editable in their original format, since many authors don’t bother. But he presents his data in such a user-unfriendly way that, unfortunately, his claim of “full transparency” rings hollow.
“Cautious” and “Reasonable” Signalling
Even though I couldn’t make much sense of Caplan’s spreadsheets, I could at least read the explanations he gives throughout the book. The two main signalling assumptions he focuses on are what he calls “Cautious Signalling” and “Reasonable Signalling”. Unfortunately, “Cautious Signalling” is not very cautious and “Reasonable Signalling” is not very reasonable.
So-called “Cautious Signalling” assumes:
- 45% ability bias for income, benefits, unemployment, and participation effects.
- 75% ability bias for crime effects.
- Sheepskin effects reflect signaling with all other effects reflecting human capital.
None of these are cautious assumptions. The 45% for ability bias is at the highest end of Caplan’s range of ability bias estimates (being 20-45%). The 75% ability bias for crime seems surprisingly high and Caplan doesn’t explain at all where he plucks this figure from. And remember—Caplan’s spreadsheets don’t let me plug in a lower assumption like 30% to see how that changes the results.
You can tell how aggressive Caplan’s assumptions actually are by comparing his social returns under “Cautious Signalling” to the social returns under 33% and 50% signalling. In every single case, the allegedly “Cautious” social returns are lower than under even 50% signalling.
Moreover, what Caplan dubs “Reasonable Signalling” is not very reasonable, either. It’s actually his upper estimate:
My best guess says signaling accounts for 80% of education’s return; I even anoint this the “Reasonable” position. Still, I am open to revision. A few outstanding studies could talk me down to as little as 60% or up to as much as 90%.
Anything called a “Reasonable” view should take the midpoint of his lower (33%) and upper (80%) signalling estimates, which is 56.5%. He doesn’t test this assumption but does test 50%, so my summary tables used that as the midpoint.
Sheepskin estimates
Under “Cautious Signalling”, Caplan assumes that sheepskin effects reflect signalling with all other effects reflecting human capital. He translates this to percentages as follows:2This is after controlling for cognitive ability. So the 38%, 59% and 74% figures aren’t estimating signalling’s overall share of the earnings premium but signalling’s share of the residual after taking out 45% for ability bias. Translated to signalling’s share of the overall earnings premium, this suggests 21% for high school (0.38 * 0.55), 32% for bachelor’s (0.59 * 0.55) and 40% for master’s (0.74 * 0.55). But this is just my interpretation of Caplan’s figures and I could be wrong. As noted in my previous post, he doesn’t clearly explain how he comes to his signalling estimates.
- 38% signalling for high school — being 2.4/6.4, because the returns from completing the last year of high school are worth 3.4 ordinary years;
- 59% for bachelor’s degree — being 5.7/9.7, because the returns from completing the last year of a bachelor’s are worth 6.7 ordinary years;
- 74% for master’s — being 5.7/7.7, same as for a bachelor’s, but a master’s is only two years long.
This is a bit rough-and-ready but seems to make sense. No major complaints from me.
Caplan then tries to work out the signalling share for the “Reasonable View”:
More plausibly, though, part of the ordinary year-to-year return is signaling as well. An extra year of education may not say a lot about you, but it says something. How much? Multiple approaches point to a Reasonable estimate of 80% signaling overall. If the sheepskin effect is all signaling, this implies a year-to-year signaling share of 57% for high school, 47% for the bachelor’s, and 25% for the master’s.
I have no idea how he gets these figures as Caplan doesn’t show his working.3I tried asking ChatGPT, Claude and Perplexity LLMs, but they got very confused too (though they all gave me very confident answers with calculations that did not add up).
Putting aside the fact that 80% is not a “Reasonable” estimate, the signalling estimates Caplan comes up with here are strange. They suggest that high school has the highest year-to-year signalling share while the master’s has the lowest. All of Caplan’s other results suggest signalling is stronger in college than high school, so the estimates here are puzzling. If you can shed light on this, please let me know in the comments below or via my contact form.
General comments on Caplan’s contrarian approach
My counsel rubs many the wrong way. Some dismiss it as “elitist,” “philistine,” or “sexist.” The correct label is candid. It’s not my fault education’s rewards hinge on graduation. It’s not my fault past academic performance strongly predicts graduation. It’s not my fault fine arts degrees pay poorly. It’s not my fault married women profit far more from education than single women. It’s not my fault so many graduates don’t work full time. I am only a messenger. My job is to honestly report the facts, especially unwelcome facts of great practical importance.
Caplan clearly enjoys being a contrarian. I can relate. It’s pretty fun.
Yet I can’t help feeling like Caplan enjoys this a bit too much. He seems to care more about stirring up controversy than about finding the truth or getting sensible policy changes passed. When I first read this book, I was sceptical of the 80% signalling estimate and didn’t agree with all of his policy stances. But I didn’t expect him to distort the evidence and research as much as he did.
Caplan’s insistence that he’s “only a messenger” feels disingenuous after all the problems I’ve found with his “facts”. He claims to be a “voice of moderation”; I can even picture him wiping his brow as he exclaims:
Instead of being a soloist crying for less education, I could join the megachorus crying for better education. Alas, my arguments hold me back.
In this case, I think the megachorus was right. On Caplan’s own calculations, high school already looks like a solid social investment on anything but the most extreme signalling assumptions. Perhaps it could be improved by focusing more on vocational education—but that’s just “better education”, not “less education”. Though Caplan could still protest government subsidies for college, he would hardly be a “soloist” there.
Caplan readily agrees that his preferred reforms are “too extreme” to win anytime soon, but nevertheless defends his stance:
… [T]his only vindicates moderate fatalism. Marginal moves in my preferred direction—or at least the prevention of further moves away from it—are still on the table. For example, why couldn’t The Case against Education motivate resistance to the rising “free college for all” movement? Or help cut foreign language requirements?
If Caplan had staked out those more moderate positions—protesting free college for all and cutting foreign language requirements—his book would have had a different title and wouldn’t have been as controversial as it was.
Part of me finds it hard to fault Caplan for being sensationalist since that was probably what led me (and many others) to read his book over those written by the aforementioned “megachorus”. But that’s a short-term win. I find it hard to trust Caplan after this and no longer plan to read his other books. Which is a shame, because some of them looked intriguing.
Conclusion
To summarise my third tranche of criticisms of The Case Against Education:
- Caplan’s spreadsheets are clunky and poorly designed, undermining his claim of “full transparency”.
- What Caplan calls “Cautious Signalling” is not cautious—especially with its hefty 75% ability bias for crime.
- What Caplan calls “Reasonable Signalling” is his upper estimate, not a reasonable midpoint.
- Caplan’s signalling estimates for year-to-year returns are counterintuitive and contradict his other findings, so should be treated with caution.
- Caplan’s claims to be a messenger reporting the facts are disingenuous. If he’d actually followed the facts, he’d have ended up with much more moderate positions and a different book title.
Thanks for joining me in this series of criticisms of The Case Against Education. If you enjoyed this post or think I got anything wrong, please let me know in the comments below. Also consider signing up to my newsletter if you haven’t already.
If you still want to buy The Case Against Education, you can do so at: Amazon <– This is an affiliate link, which means I may earn a small commission if you make a purchase through it. Thanks for supporting the site! 🙂
If you enjoyed this post, make sure you check out:
- Criticisms of The Case Against Education (Pt 1 — it’s The Case Against Higher Education)
- Criticisms of The Case Against Education (Pt 2 — Inflated Signalling Estimates)
- Why I write criticism posts
- 1I should also point out that Bryan Caplan’s site does not have an SSL certificate so my browser warned me that the download might be infected. I (perhaps recklessly) pressed on but that could have also deterred more cautious people.
- 2This is after controlling for cognitive ability. So the 38%, 59% and 74% figures aren’t estimating signalling’s overall share of the earnings premium but signalling’s share of the residual after taking out 45% for ability bias. Translated to signalling’s share of the overall earnings premium, this suggests 21% for high school (0.38 * 0.55), 32% for bachelor’s (0.59 * 0.55) and 40% for master’s (0.74 * 0.55). But this is just my interpretation of Caplan’s figures and I could be wrong. As noted in my previous post, he doesn’t clearly explain how he comes to his signalling estimates.
- 3I tried asking ChatGPT, Claude and Perplexity LLMs, but they got very confused too (though they all gave me very confident answers with calculations that did not add up).